


The Review
The firm was in its third growth year, roughly $900,000 billed, and the quarterly marketing review was impressive. Impressions up. Cost per lead down 18%. Consultations at a record. Gross billings at a record. Four numbers on one page, each one accurate, each one trending the right way. The agency’s rep walked the deck in twenty minutes. The retainer continues for another quarter.
Then the owner reconciled the operating account. The quarter closed within dollars of the same quarter last year. This doesn’t add up.
Nobody in that review had an explanation. They couldn’t point to anything in that report that could provide one.
The Turn
The number is real. What it implies is wrong.
Every metric in that report focuses on how much was spent. Impressions and clicks price what the ad auction charged for attention. Leads and consultations measure how much demand was created, with every inquiry counted the same regardless of its value. Gross billings record what the firm intended to collect. Three meters, all bolted to the same side of the transaction: the side where money and hours go out.
The report supposedly shows ROI. What they’re actually presenting is “spend” packaged as “return.” This is the entire problem. And improvement in the metrics does nothing to fix it. A cheaper lead is a better price on the spend. It doesn’t carry any information about what came back.
Same Line, Different Money
Run two matter types off the same P&L. Both put $10,000 a matter on the gross revenue line, so the practice management report scores them identical.
The first is fixed-fee transactional work. It collects at 97% inside 30 days, and a matter consumes about seven owner hours once the drafting, the calls, and the closing are counted. The second is hourly work billed in arrears. It collects at 84% after 90 or more days, and a matter has eaten twenty owner hours by the time the file closes.
Same line on the revenue report. After collection and direct costs, the first pays more than $1,200 for each owner hour it ate up. The second pays under $400.
A gap that wide, running through a single revenue line, is completely missing from any of the agency's reports. It compounds, too. The second kind of work generates the most inquiries, so the record consultation quarter fills the calendar with work that pays a third as much per hour. The marketing engine gets better and better at buying the wrong matters.
Name your own pair. Every firm has one: the work that fills the week and the work that pays for it. They’re rarely the same work.
The Ladder
The mechanism is a ladder, and each rung throws away information the next rung needs.
Click. Lead. Billed. Collected. Contribution per owner hour.
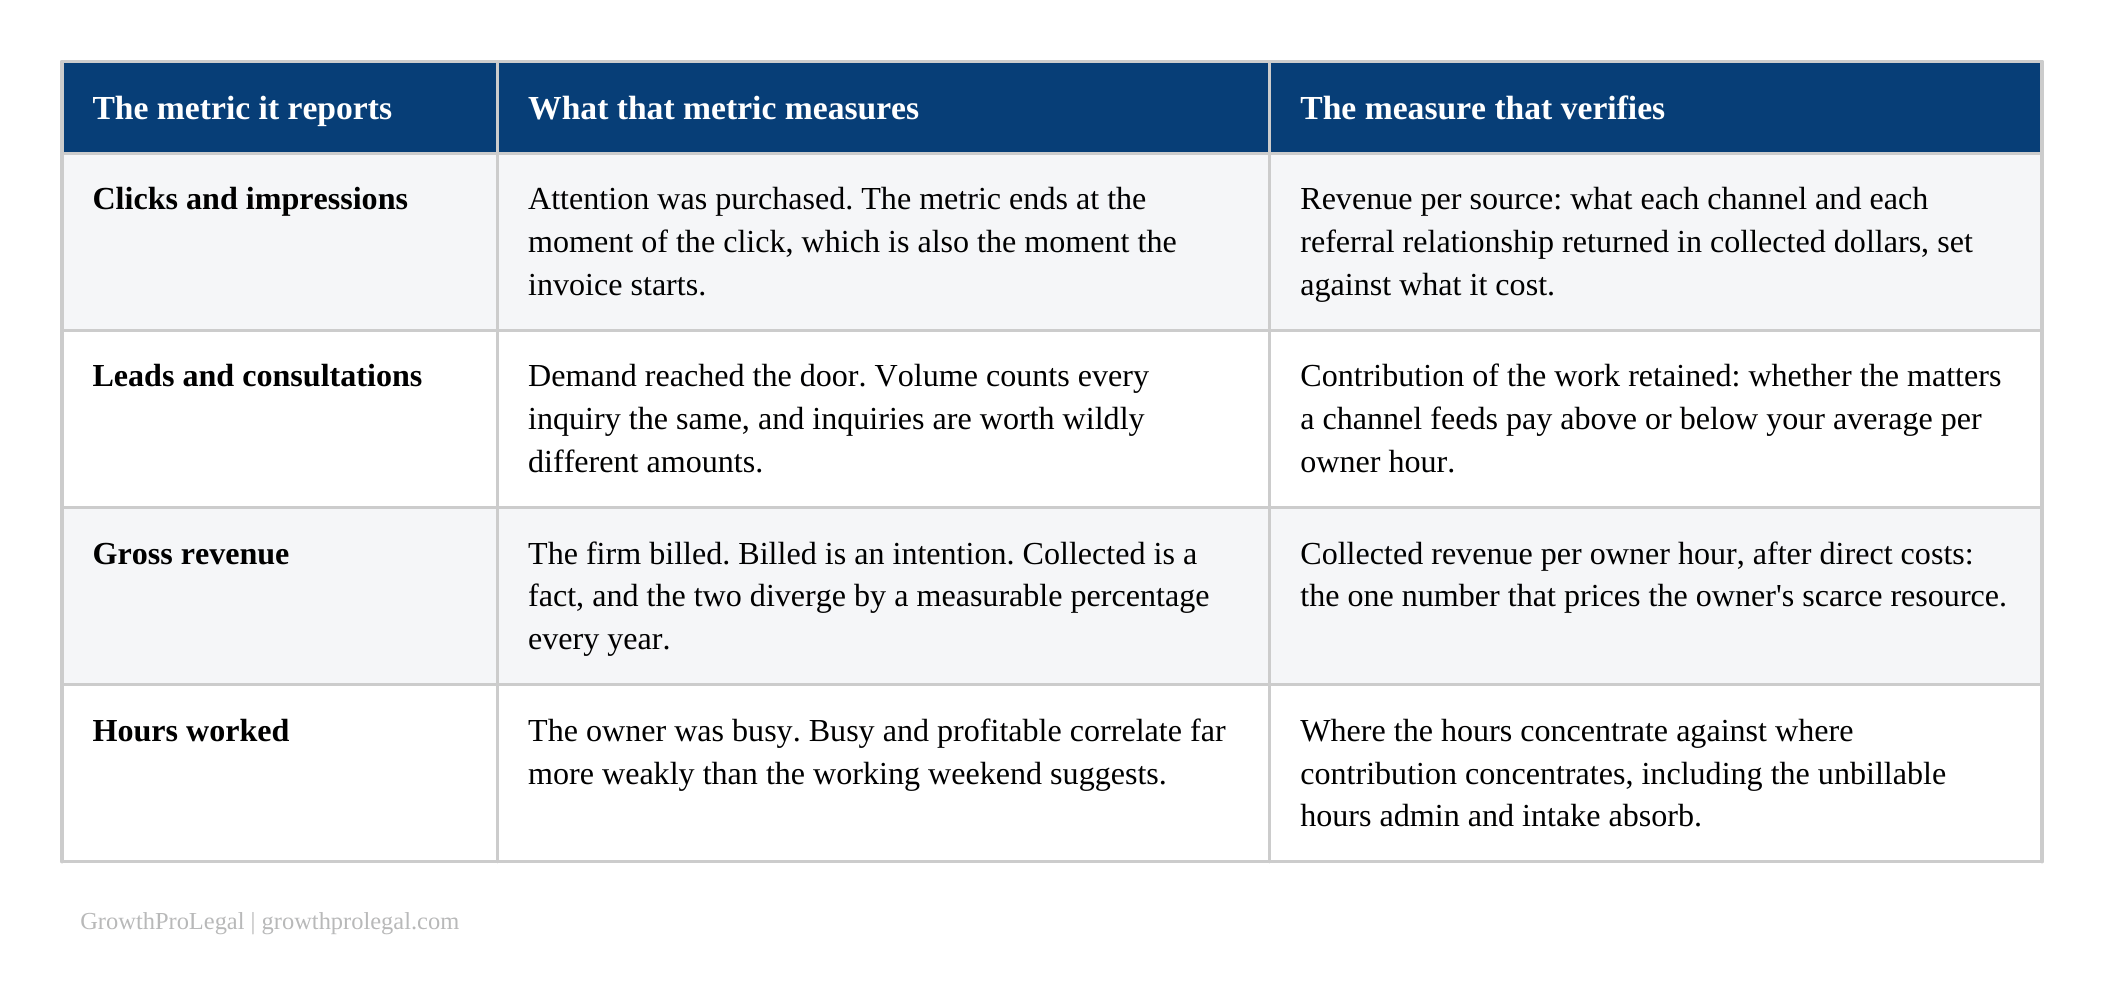
A click doesn’t tell us if the visitor ever became a matter. A lead doesn’t tell us what the matter was worth, because volume counts a $2,000 inquiry and a $40,000 inquiry as one each. Billed doesn’t tell us if the money arrived, and that part is measurable: per the Clio Legal Trends Report, the average lawyer collects $910 per $1,000 of billable work performed, about 14% of billable work at solo and small firms never gets invoiced, and roughly a tenth of what does get invoiced goes unpaid. Collected doesn’t tell us what the return cost in owner’s hours to produce them.
The marketing report stops at rung two. The firm’s economics start at rung four.
The full map, one row per metric.
The join
Here’s why the metric gap survives year after year unmeasured. Contribution per owner hour requires a partnership among three systems that don’t communicate with each other. The practice management platform reports gross by matter. The bank records collected in aggregate. The hours, where they’re tracked at all, sit in a third system, and at fixed-fee firms they’re usually not tracked at all, which is why the effective rate goes invisible. No standard report performs the join. The one number that prices the owner’s most valuable and scarce resource is the one number no system produces by default.
The close
A vanity metric measures what was spent. A structural measure prices what came back. Growth that survives measurement is the only kind worth buying.
The candidate zone is the work paying below the firm’s own average per owner hour. The threshold is the firm’s number, produced by the firm’s own decomposition, and this essay doesn’t know it.
The Growth Intelligence Scorecard runs this read in general form, from numbers you already carry. Free, four minutes, in your browser: growthprolegal.com/scorecard
This letter is not legal advice and not accounting advice. Scenarios are anonymized archetypes with rounded figures.
The analysis in this letter is produced under Revenue Intelligence & Decision Architecture (RIDA), the proprietary economic discipline that Legal Growth Intelligence runs on and runs for the firms it serves. The doctrine, the case record, and the engagement formats are at blsheets.co and growthprolegal.com